Step 5: Visualize Model Outputs#
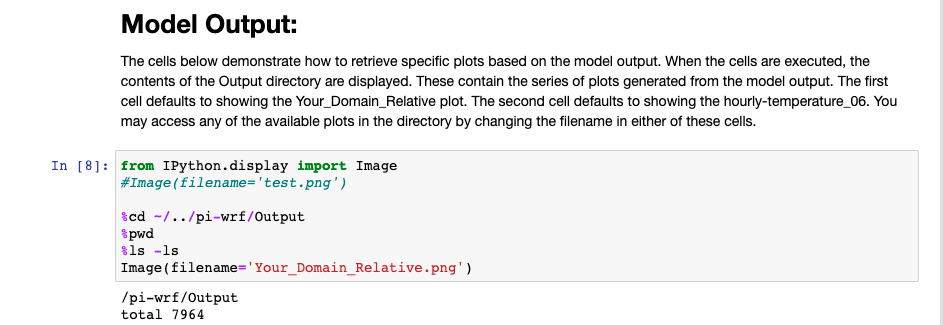
These steps assume you already have the application running on a Raspberry Pi or local computer running. Running WRF in step 3.3 above outputs different weather graphs/visuals (approximately 7000!) and stores them in the ~/../pi-wrf/Output directory.
You can list the output file names using the terminal command ls (this is already entered in the notebook).
Finally, to visualize any plot of interest, use the image library and the file name as shown in the code block below:
Image(filename='name-of-file.png')
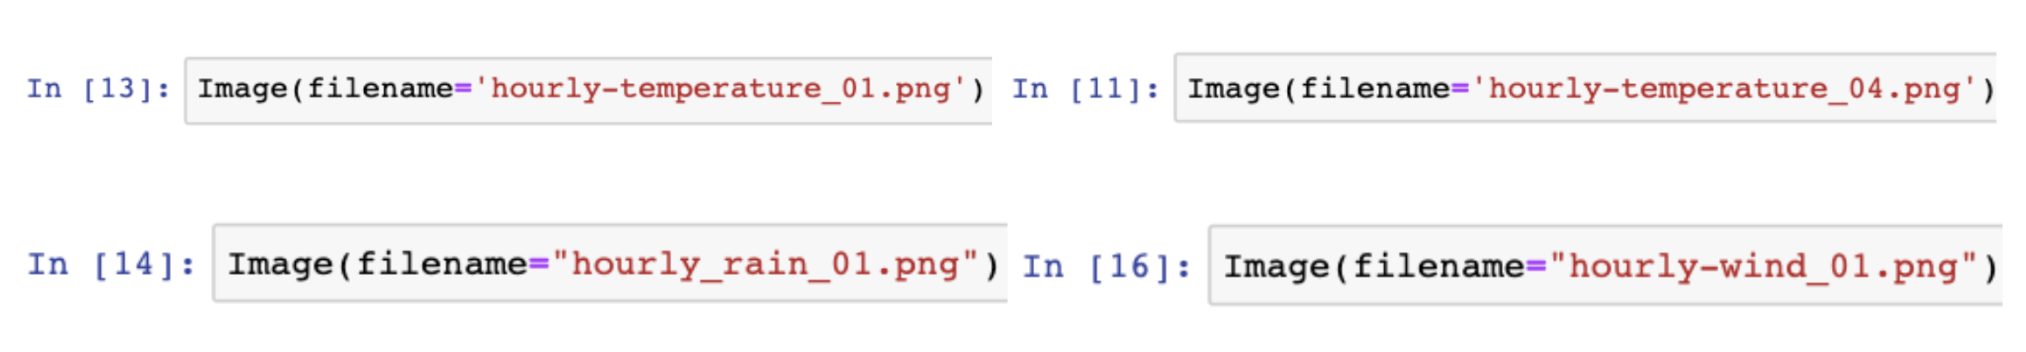
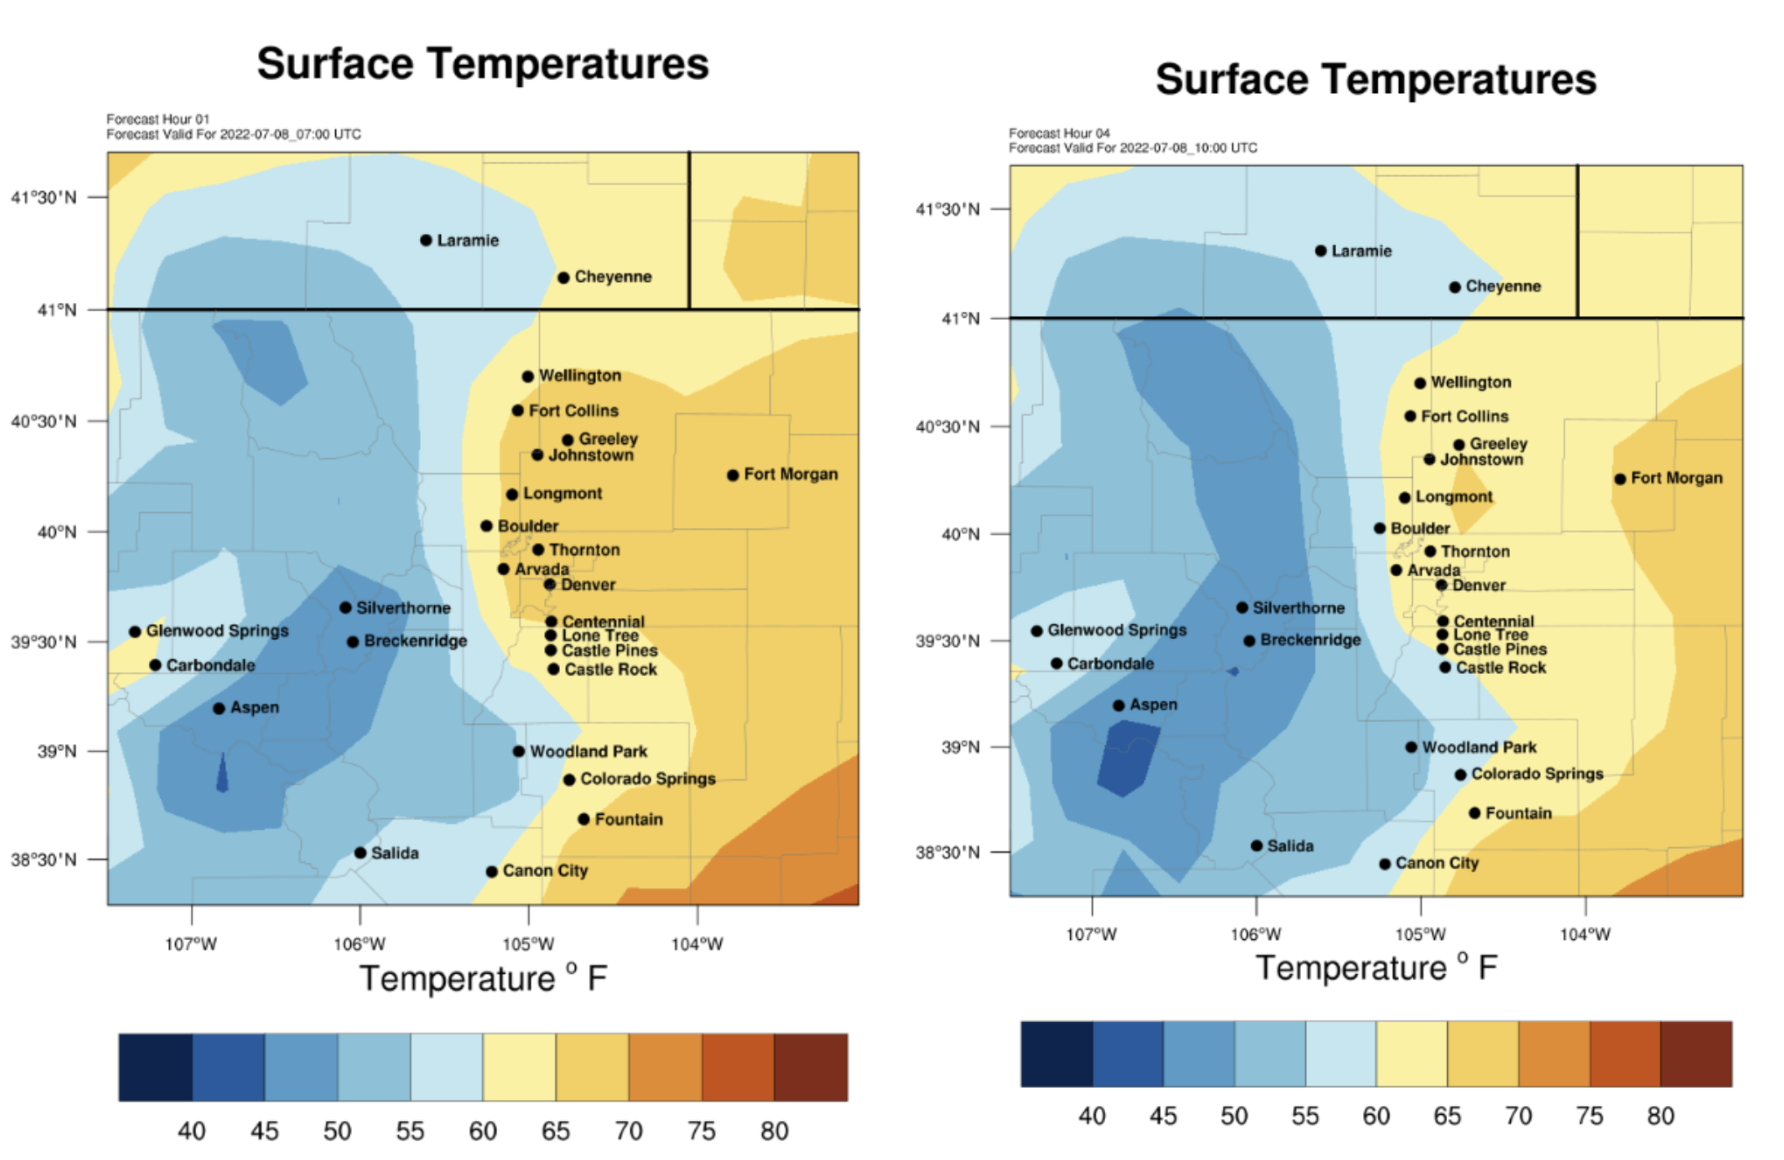
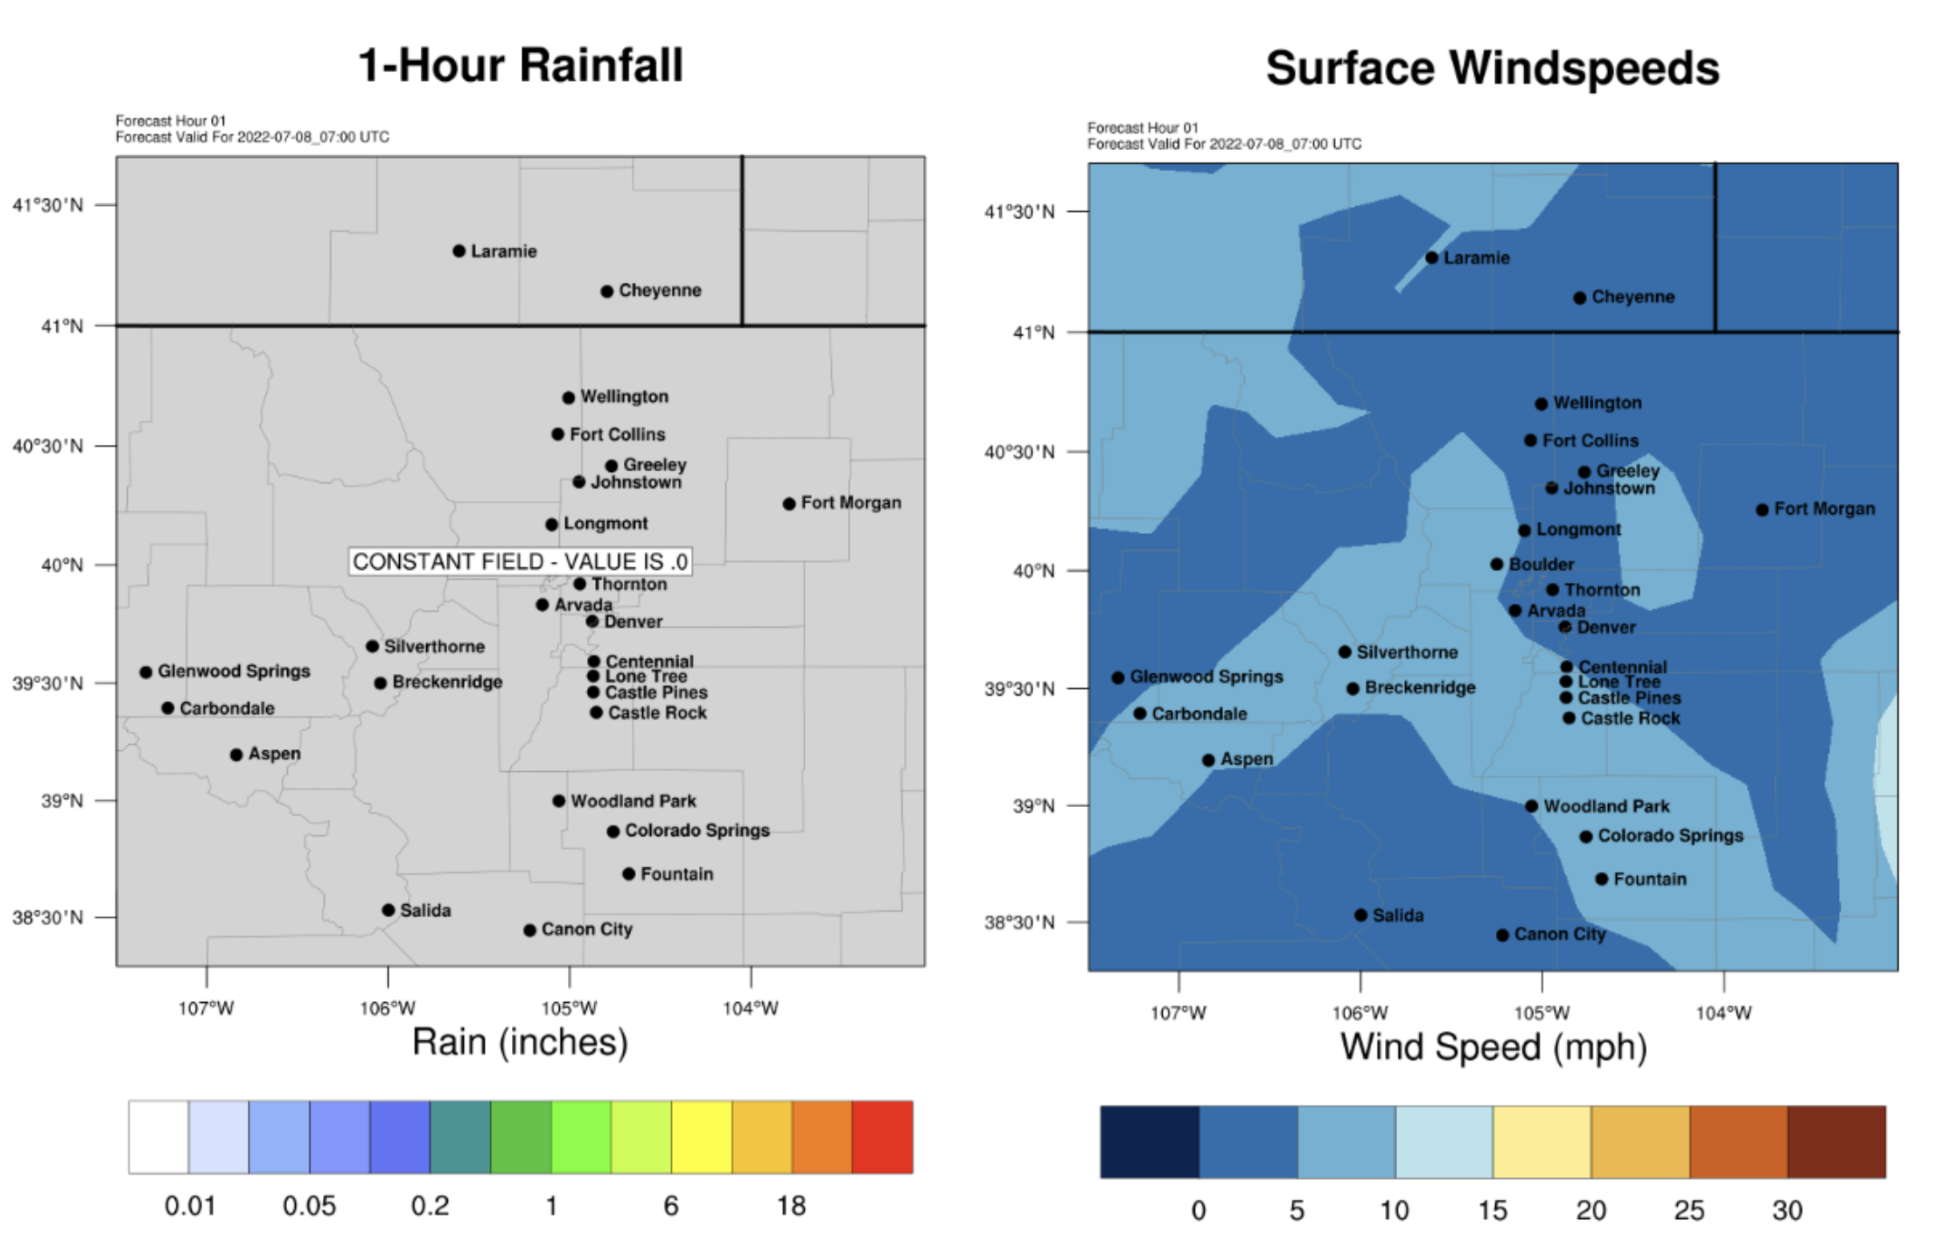
In this lesson, I will be visualizing the hourly temperature plots since I already decided that I was going to tell my weather story using temperature forecasts. However, I included a variety of outputs here to provide some clues about the various weather plots WRF can provide.
Sample Outputs: